Engagement Path
Clarity over rebuilds. Fix what matters first.
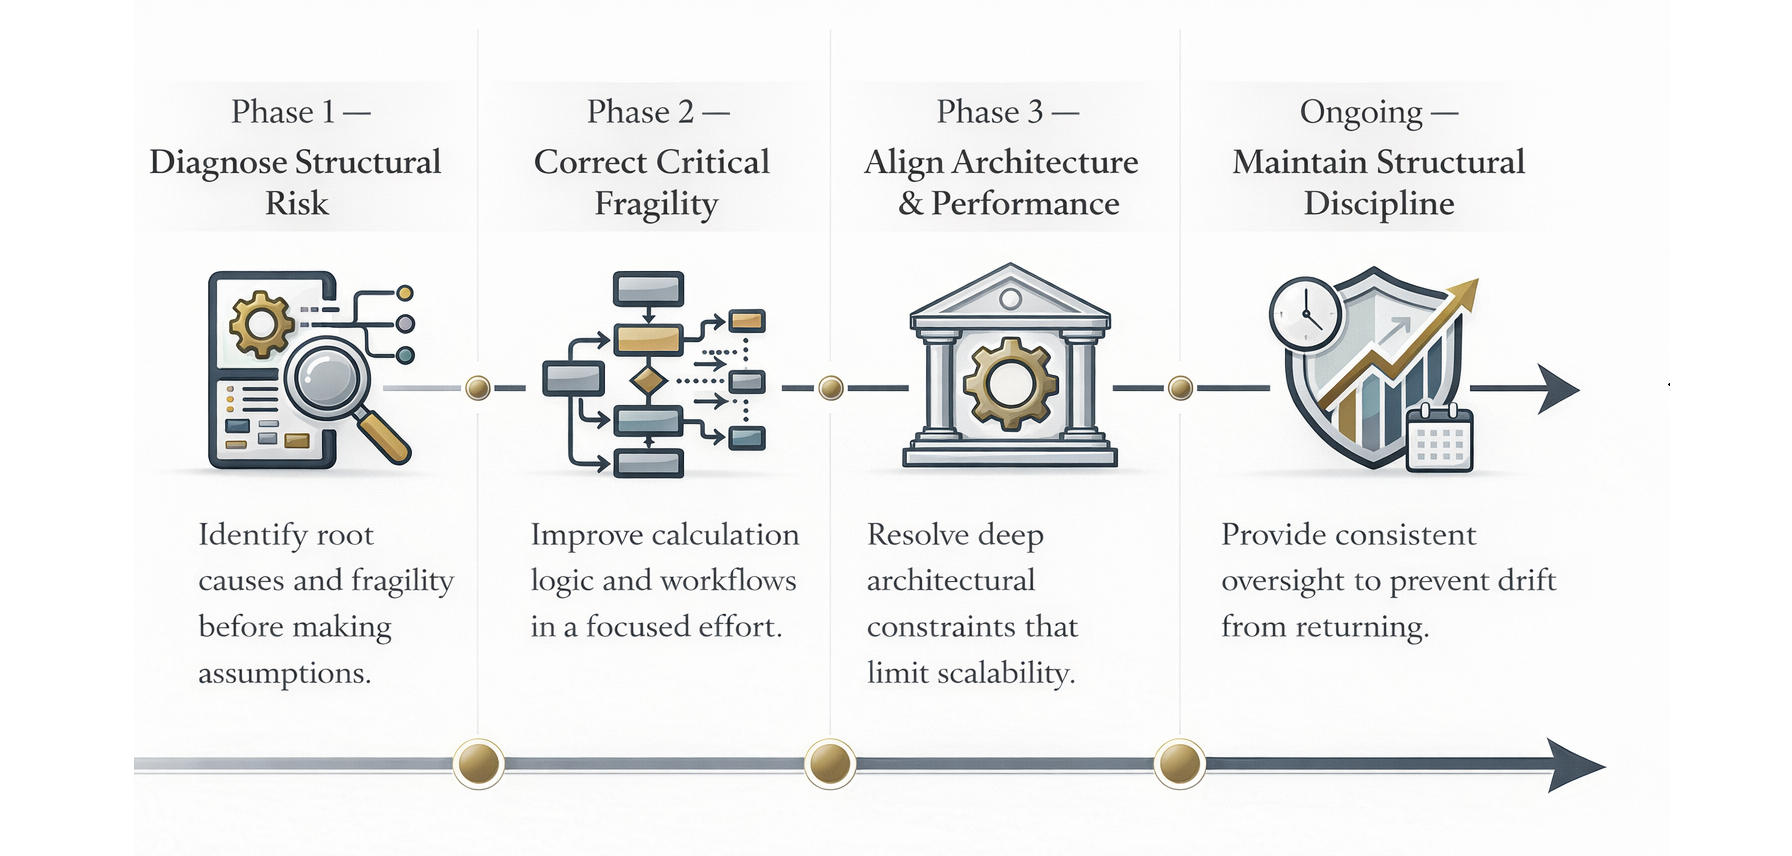
Engagements follow a structured progression based on the complexity and constraints of your environment.
Most engagements begin with Phase 1 — Diagnostic.
-
Clarify the Real Constraint
Most planning systems don’t fail overnight — they accumulate drag.
The Diagnostic is a short, focused engagement designed to identify structural constraints, performance bottlenecks, workflow friction, and cross-system inefficiencies before corrective work begins.
Deliverables:
Root causes (not symptoms)
Immediate quick wins
A prioritized Fix-It-First roadmap
This phase ensures effort is directed where it matters most.
Most engagements begin with Phase 1 — Diagnostic. Book an intro call to determine fit.
-
Correct Logic & Workflow Friction
Once root causes are identified, targeted corrections resolve logic breakdowns, usability friction, and workflow inefficiencies.
This is not a rebuild. It is disciplined correction based on impact.
Outcome:
Reduced manual work
Cleaner workflows
Improved reliability under pressure
-
Realign System Architecture
When constraints are systemic — not tactical — architectural correction becomes necessary.
This work addresses:
Model dimensionality
Data flow
Calculation structure
Cross-system boundaries
Outcome:
Improved performance at scale
Reduced technical debt
Systems aligned to real operating cycles
This phase is appropriate when incremental fixes no longer produce meaningful improvement.
-
For business-critical systems, structure degrades without active oversight.
This phase provides ongoing structural oversight through:
Continuous performance tuning
Architectural guardrails for new enhancements
Priority response to emerging structural risk
Ongoing architectural direction and governance
This is not reactive support. It is structural stewardship.
When This May Not Be the Right Fit
This approach is designed for live, business-critical planning environments.
If you are looking for:
A full greenfield implementation
A pure technical staff augmentation model
A large consulting team
There may be providers better aligned to those needs.
How Engagements Typically Progress
Example:
Intro Call
Focused Diagnostic (1–2 weeks)
Targeted Correction
Architecture Alignment (if needed)
Ongoing Oversight (optional)
What Improves
Engagements are measured by outcomes, not activity.
Reduced forecast cycle time
Improved model performance at scale
Increased user trust and adoption
Reduced manual reconciliation effort
Cleaner reporting and handoffs
Most engagements begin with a focused Diagnostic.
Book an intro call to determine fit.
Engagement Outcomes
Engagements typically result in:
• Model size reductions and more efficient structures
• Faster calculation performance and improved responsiveness
• Simplified model architecture that is easier to maintain and extend
• Reduced complexity across planning and reporting workflows
• Systems that remain stable during critical planning and reporting cycles
Selected Engagement Examples
-
National Consulting Firm — Post-Implementation Reporting Rescue
Situation:
A redesigned Excel reporting process met formal requirements but failed under full operating scale. Consolidation was manual, reporting files exceeded 300MB, and refresh cycles required manual calculation mode.Action:
Introduced automated VBA-based consolidation and rebuilt the reporting model with performance as a primary design constraint.Impact:
• Manual consolidation eliminated
• Reporting file size reduced dramatically
• Refresh times stabilized
• Reporting usable at full data volume -
$4B Manufacturer — Anaplan Performance Rescue
Situation:
Post-implementation, the Anaplan model slowed under peak forecast cycles. Excel workarounds increased, reporting became rigid, and adoption declined.Action:
Redefined system roles. Refocused Anaplan on consolidation and transformation. Replaced embedded reporting logic with structured source sheets feeding Excel and BI tools.Impact:
• Model size reduced by ~50%
• Forecast cycle time reduced from multi-week turnaround to days
• Manual exports eliminated
• Performance stabilized under quarter-end pressure
• User adoption increased without retraining -
Multi-Entity Healthcare Platform — Excel + Anaplan Architecture Realignment
Situation:
Excel-based reporting had been stabilized but remained difficult to scale and validate across entities.Action:
Maintained Excel as the user interface while moving validation, consolidation, and governance into Anaplan. Introduced standardized templates and automated BI refresh.Impact:
• Reporting refresh time cut by more than half
• Data validation embedded at load
• Excel file complexity reduced again
• Automated Power BI reporting for leadership
• Scalable architecture without forcing tool migration
All engagements are led directly by Dan Schenk, an Anaplan Certified Solutions Architect with more than two decades of experience designing and optimizing complex financial planning systems.
Learn more about the experience behind the approach.